The Raman spectrometer MA-RBE-V02E is well suited for a variety of applications. All examples shown below are taken directly from the device's software.
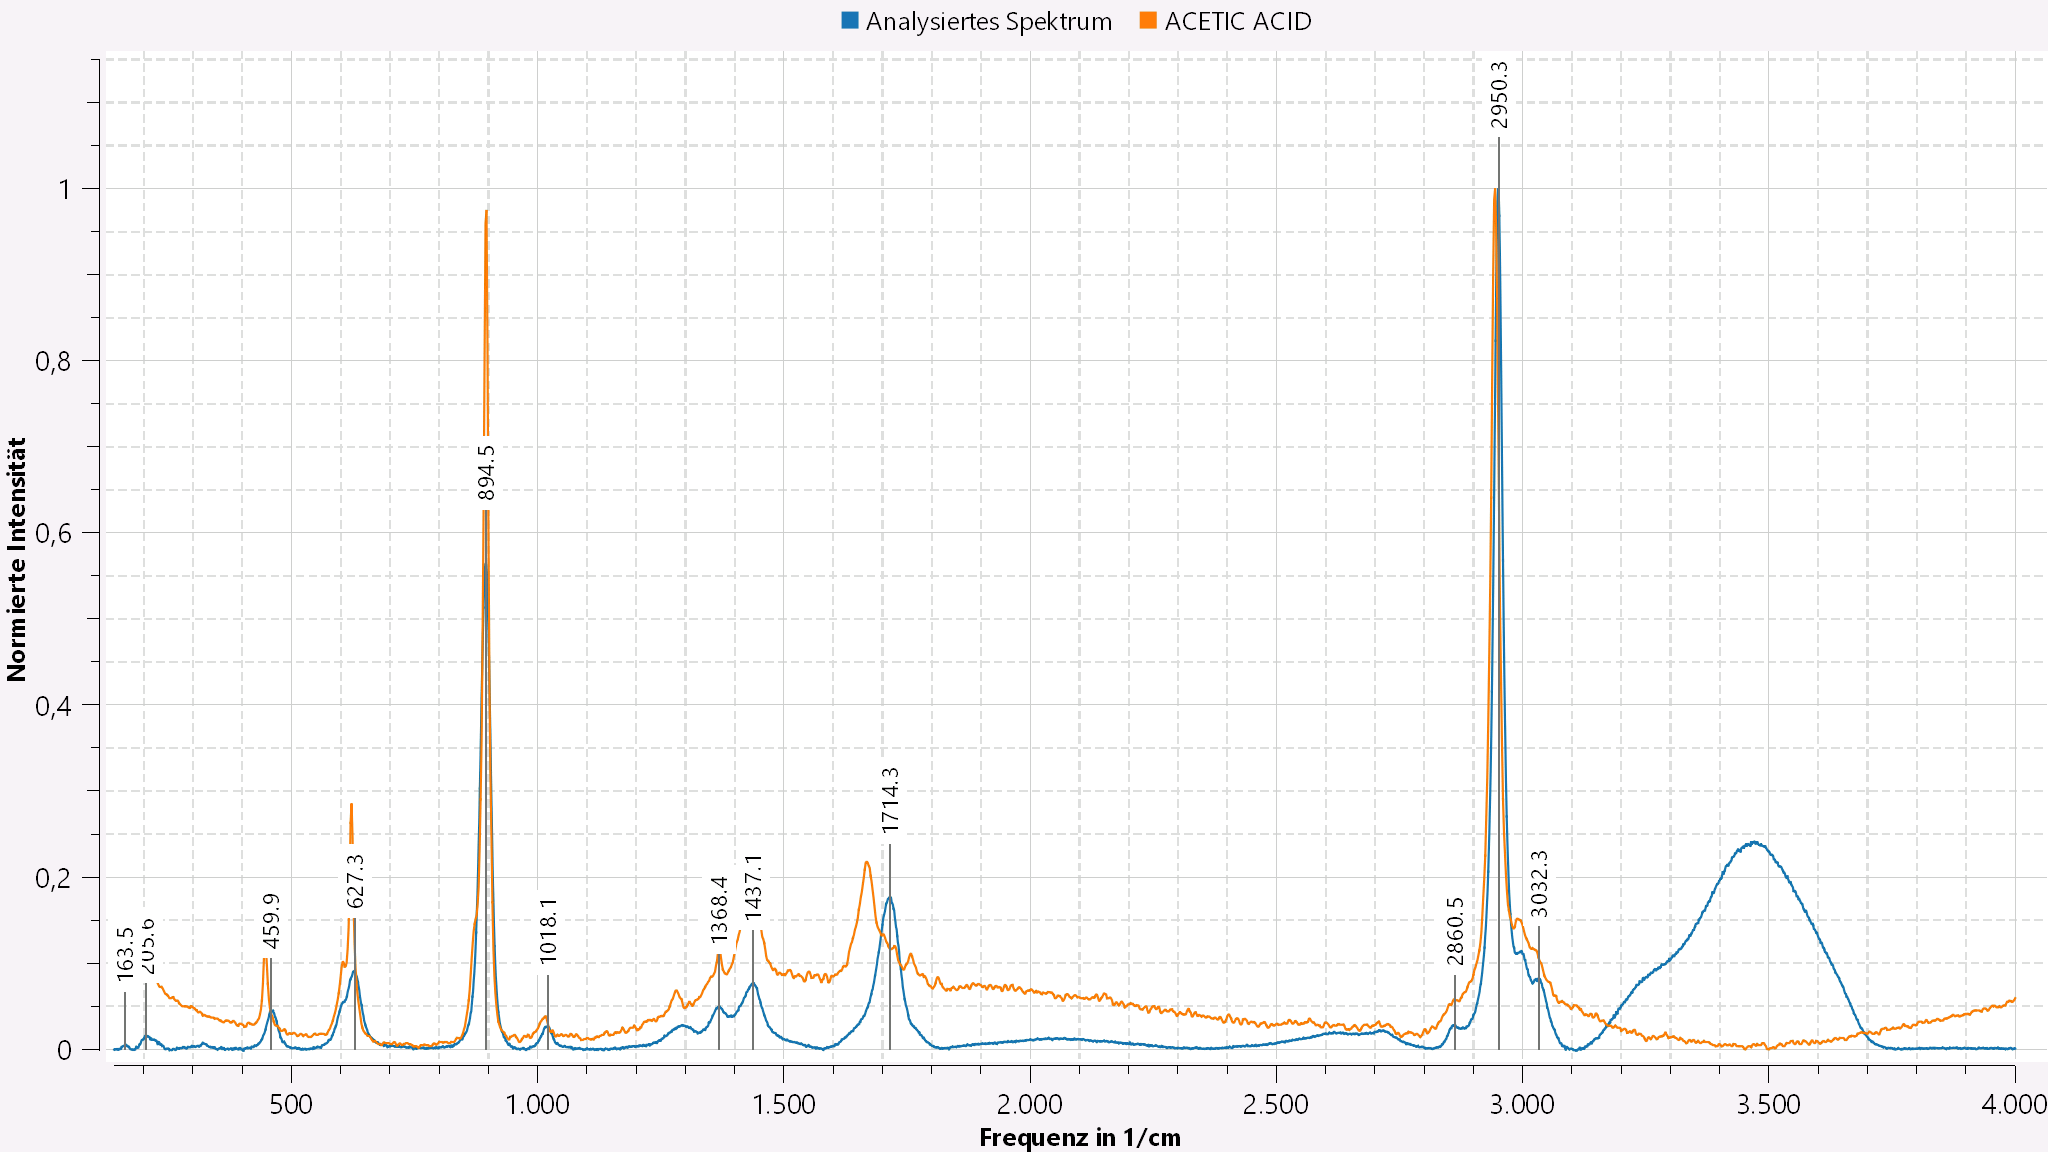
Identify a variety of materials (solid or liquid) automatically and reliably in seconds. Shown here: Acetic acid in water.
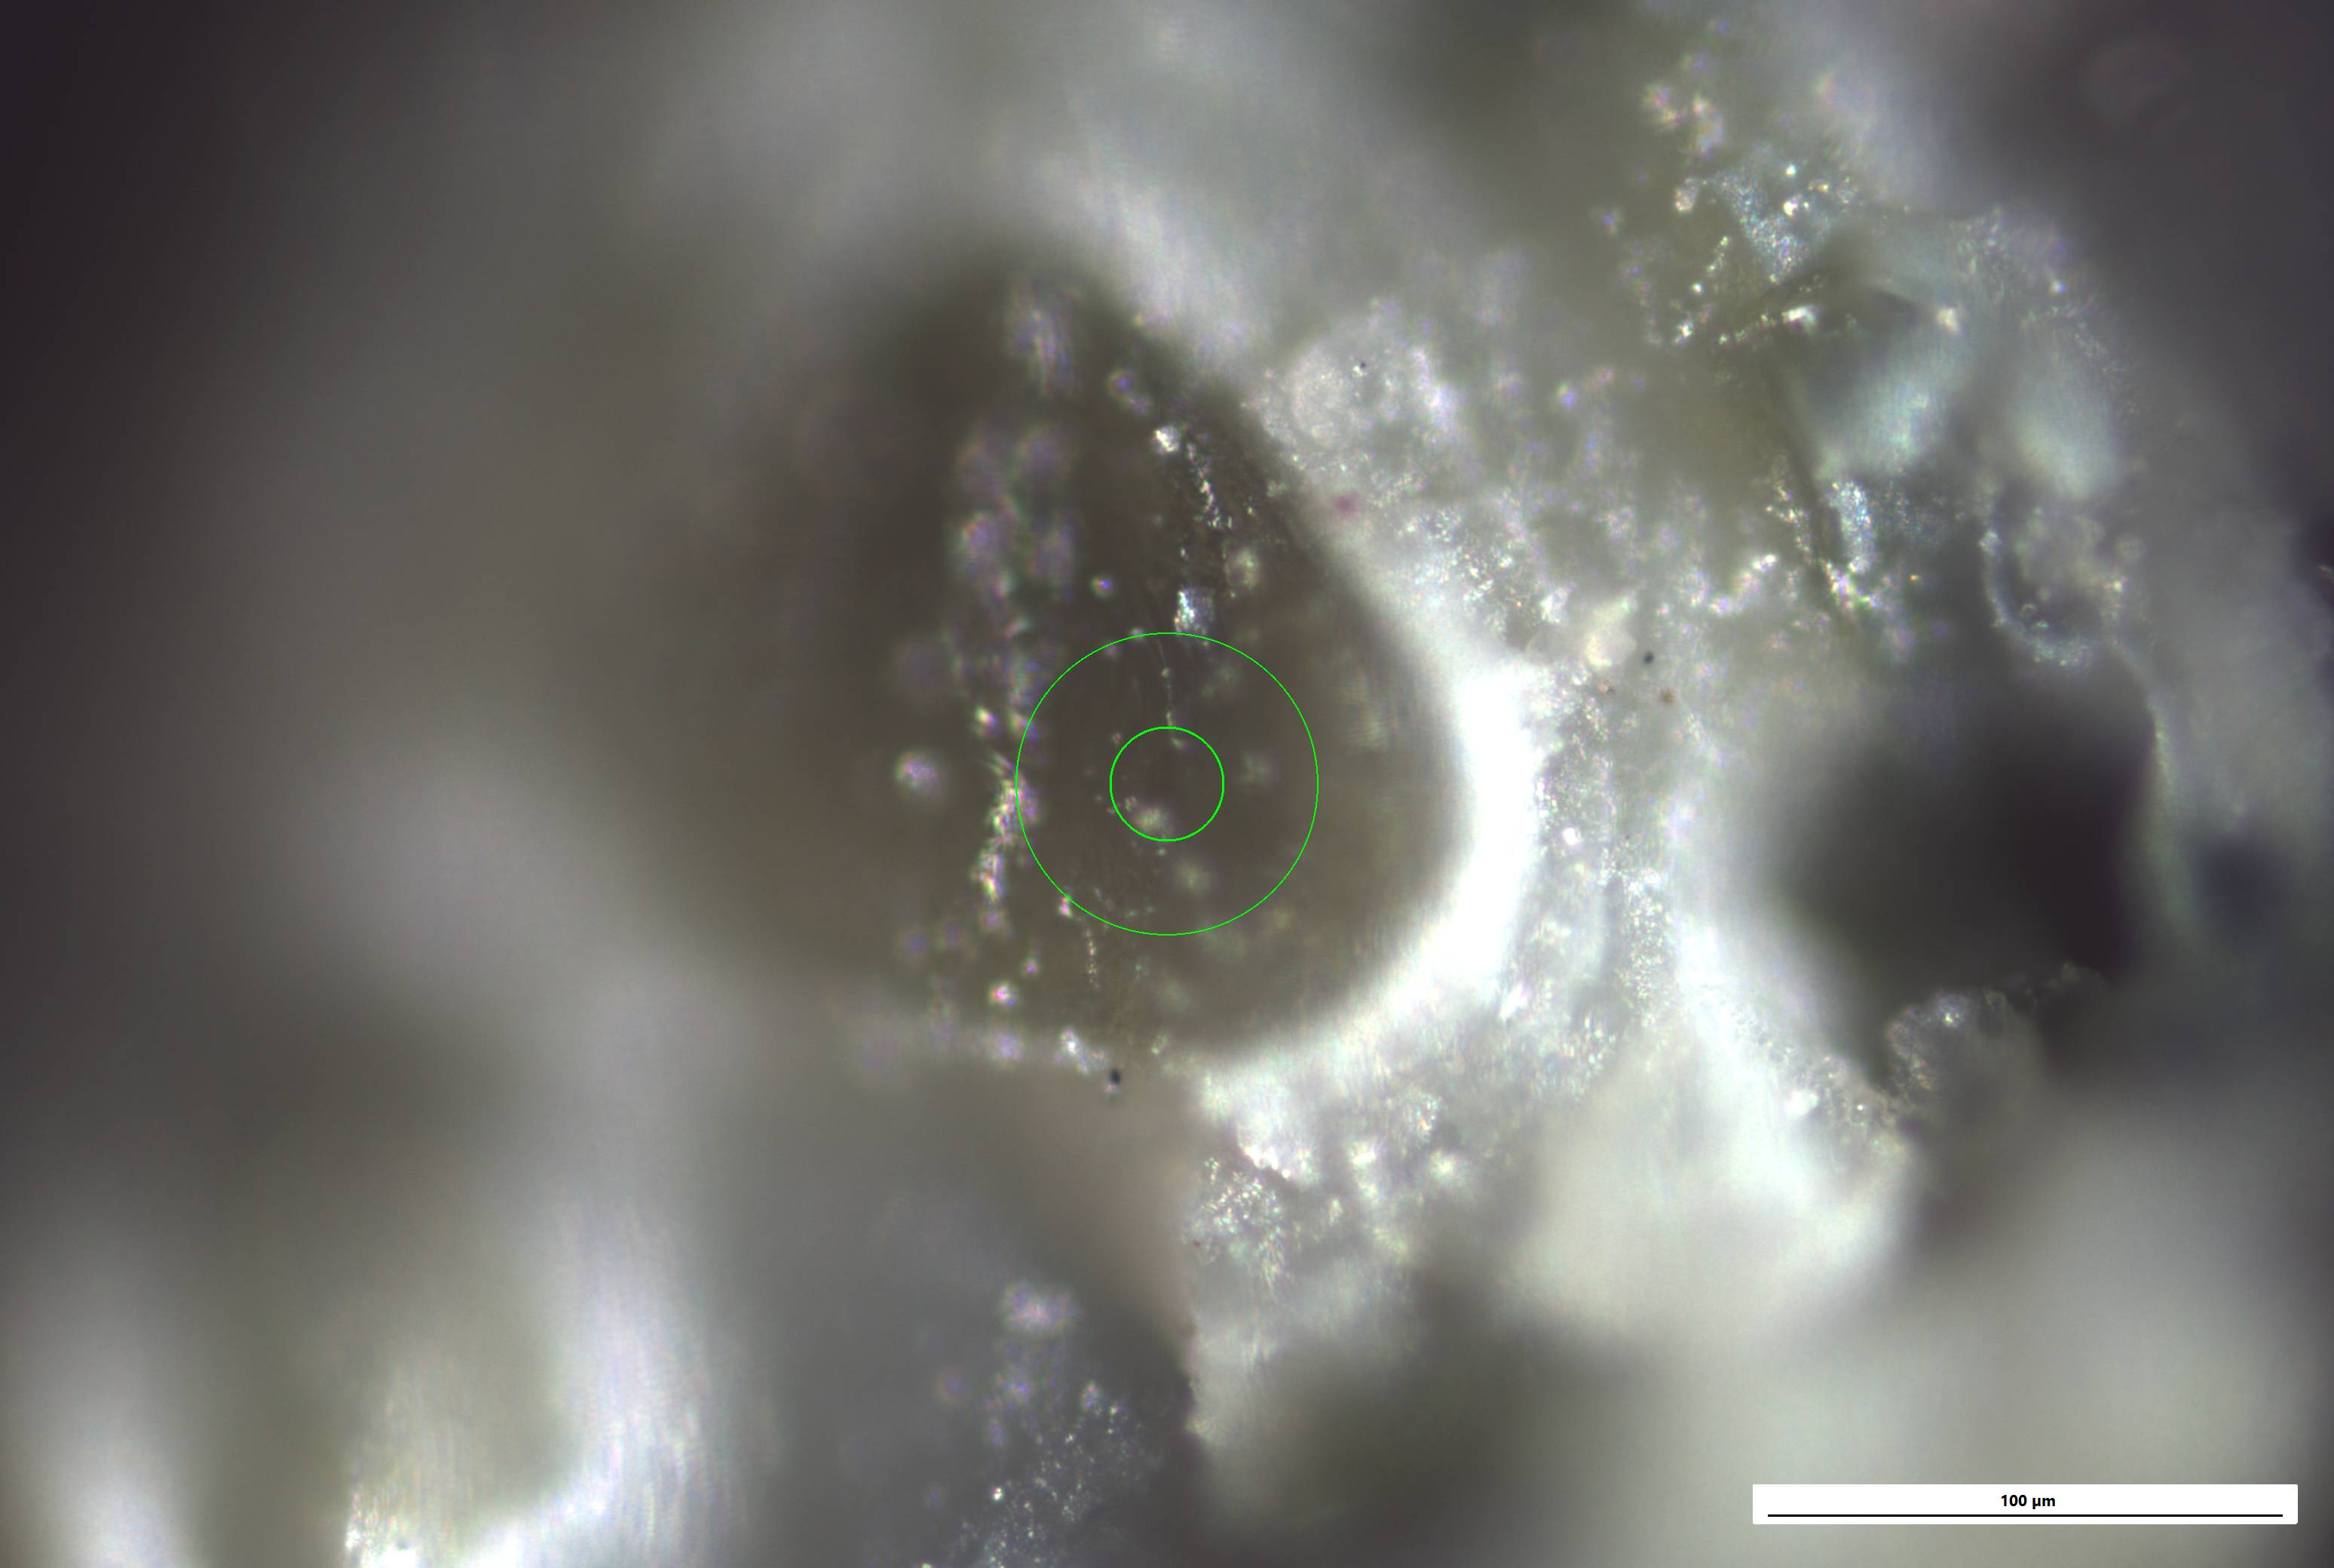
Select measurement regions few micrometers in size for analysis using the built-in microscope.
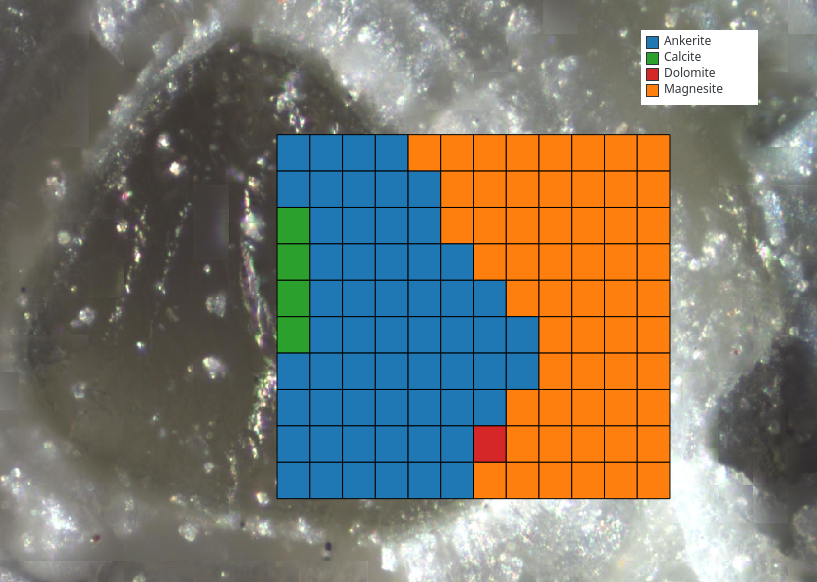
Measure and visualize many Raman spectra on a grid, also on uneven surfaces. Our software creates a single sharp image from multiple microscope images, and automatically computes the focal point.
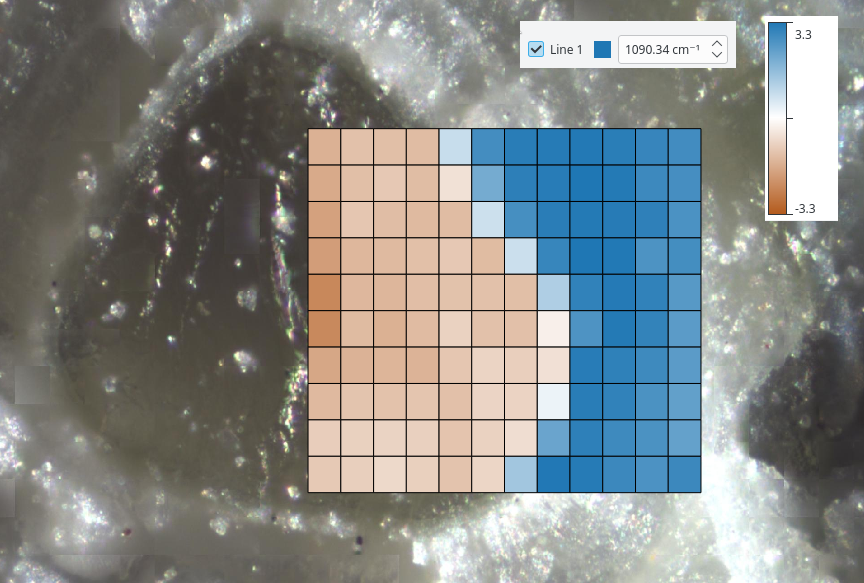
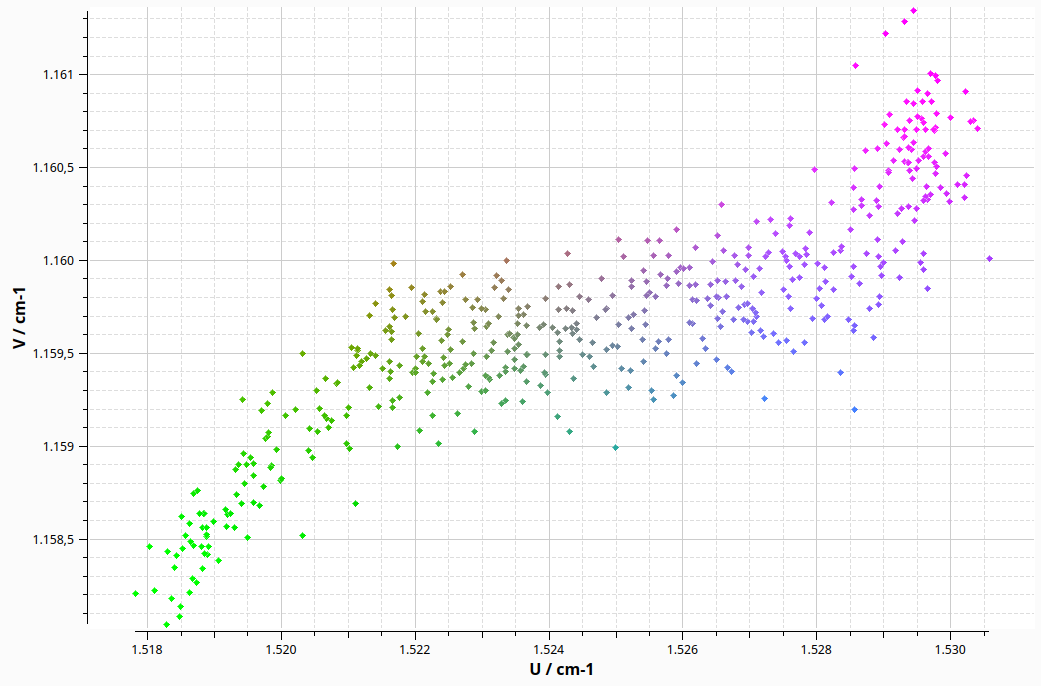
Perform fully automated or manually guided analyses of these data. Colorized here: deviation of the 1090 cm-1 line by up to 3 wavenumbers.
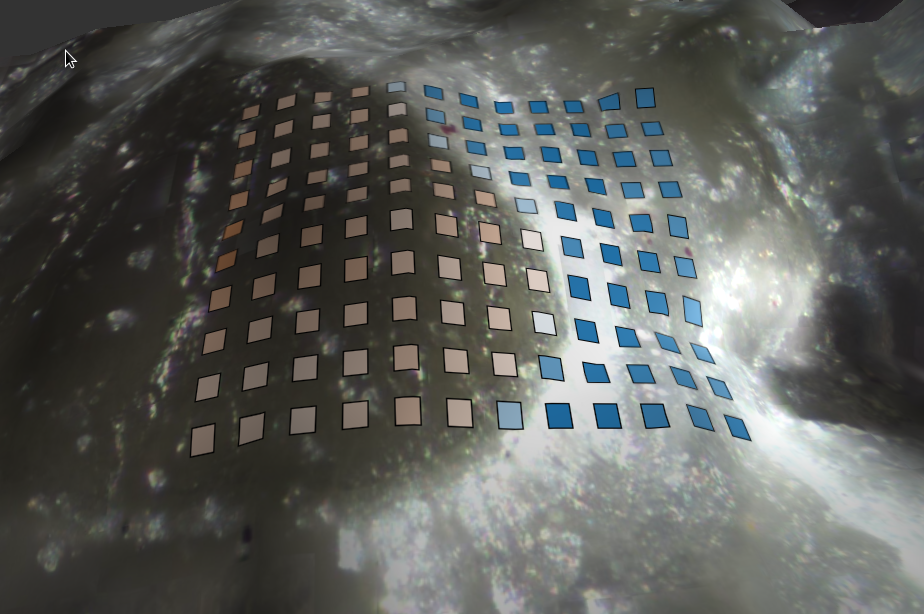
Our system calculates interactive 3D models from depth-of-field information, which greatly simplifies measuring on complex geometries.
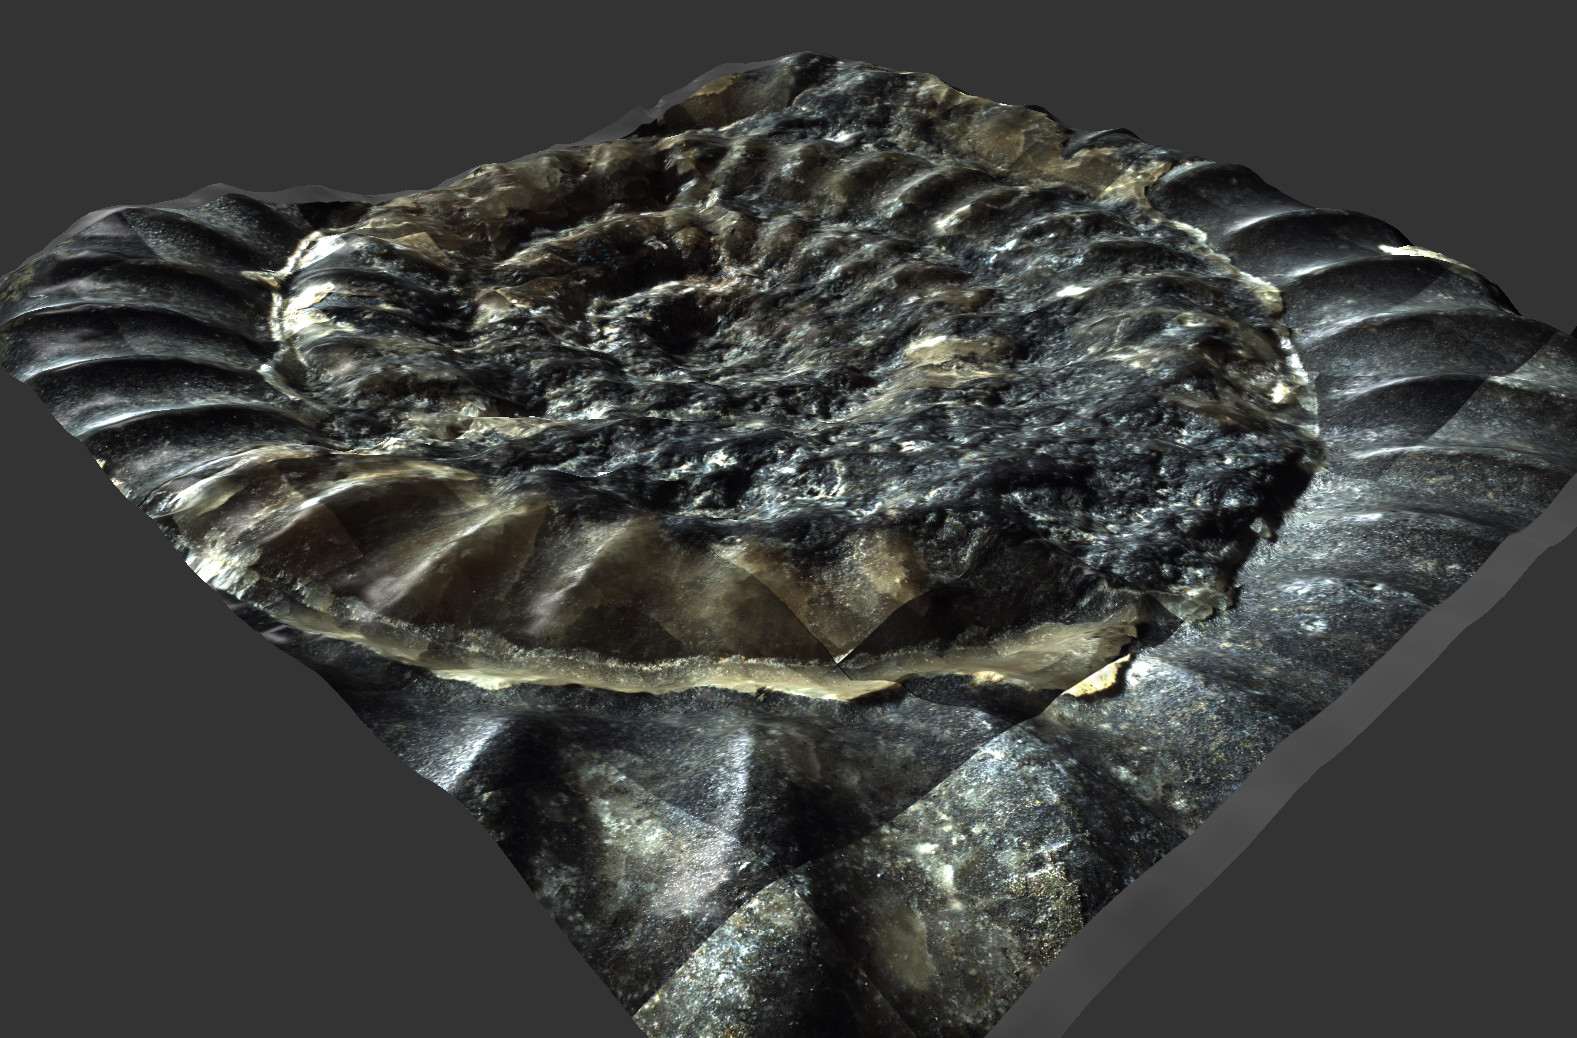
In many cases, like for this fossilized ammonite, these images alone are very interesting already.
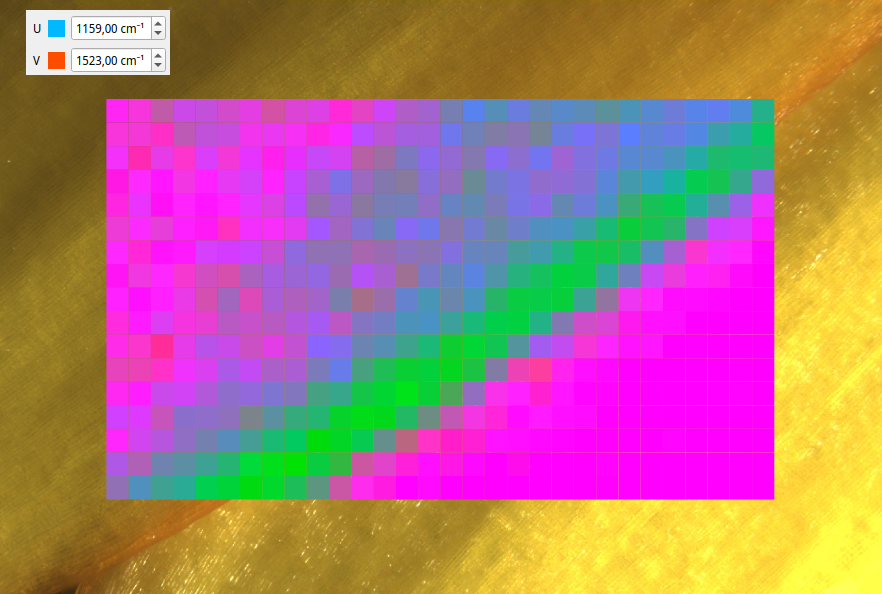
This scan of a flower petal shows distribution of different Carotinoids by position of two differet Raman lines, similar to Tissue-specific accumulation of carotenoids in carrot roots.
For the two-line analysis (here again for Carotinoids) the distribution of line shift is often interesting. A similar method is employed in e.g. Micro‑Raman spectroscopic analysis on natural carbonates.
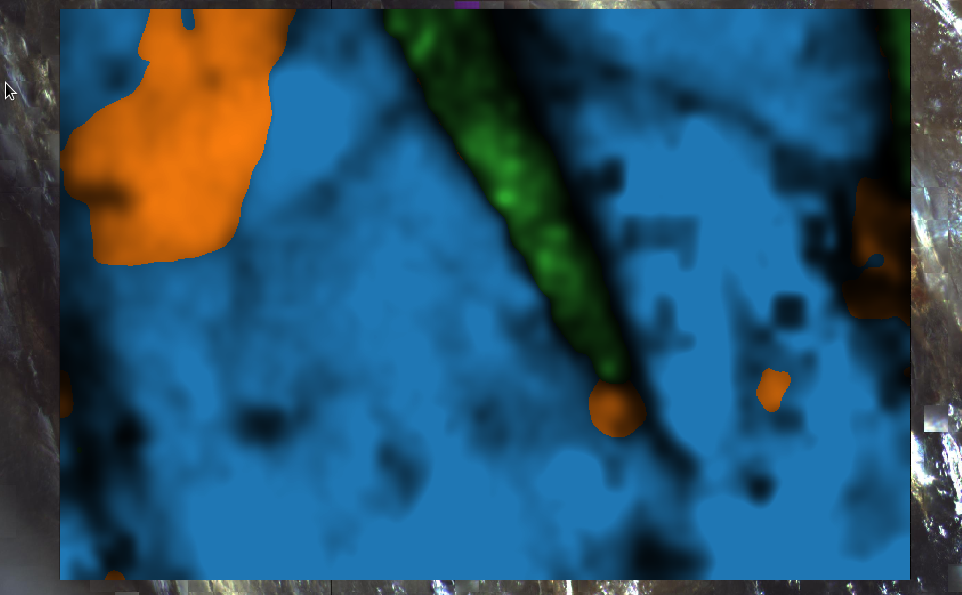
Software also computes high-resolution Raman images from the grid measurement data, shown here for a sample of Enstatite (Mg2Si2O6, blue), Diopside (CaMgSi2O6, orange), and Tridymite (SiO2, green).
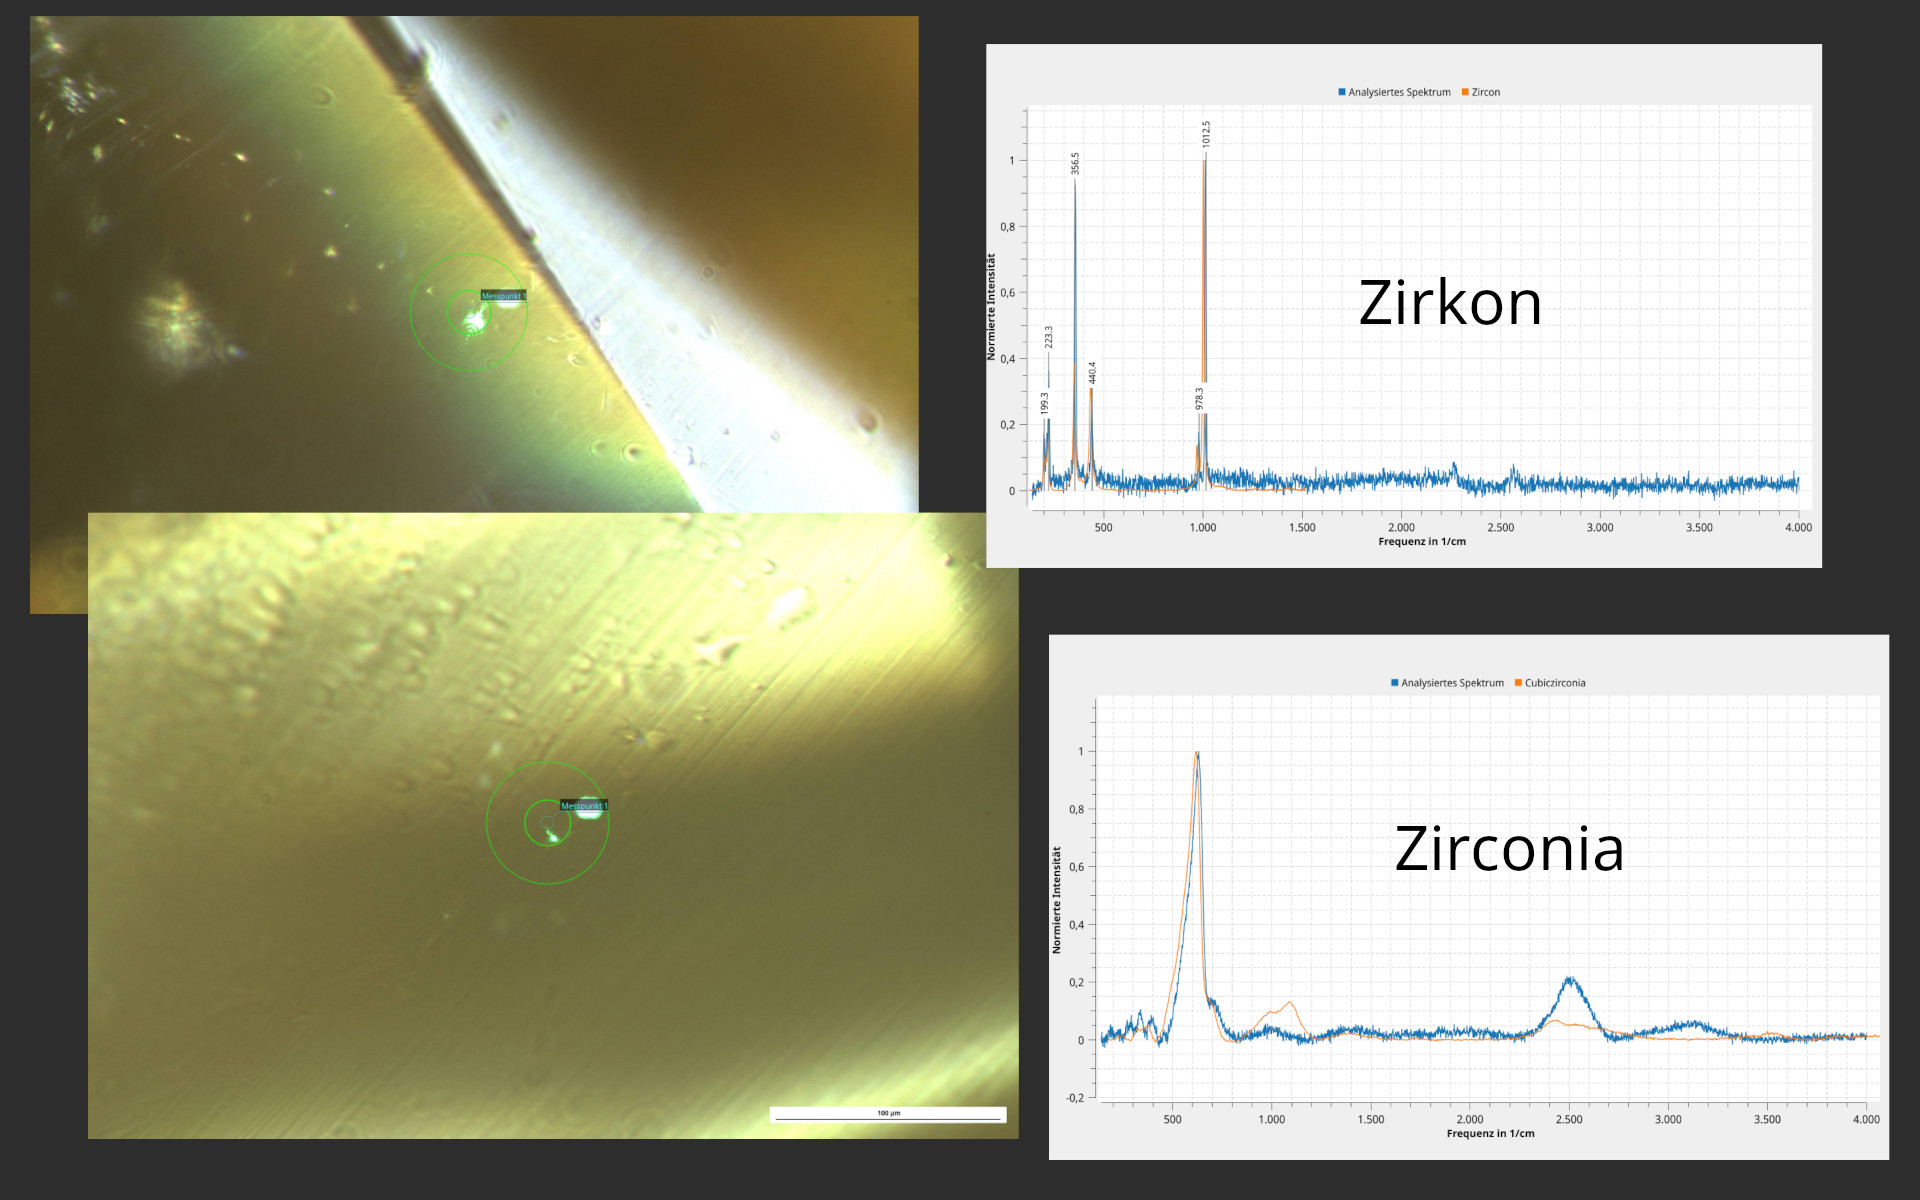
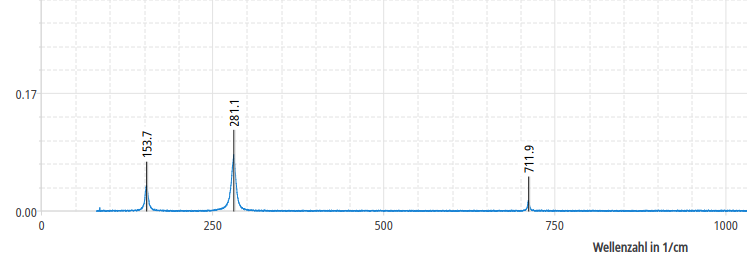
The device is also ideally suited for 100% reliable verification of jewellery and gemstones, shown here Zircon (Zr[SiO4]) and technically synthesized Zirconia (ZrO2).